Case study Local SEO
Turning a red map green for a live illustrator
Ksenia Craven is a live-event illustrator and fashion designer in Florida, the kind of business that gets booked when someone nearby searches for a 'live illustrator'. When we started, she barely showed on the local map. A year of local SEO turned a grid of red into a grid of green.
The challenge
Ksenia Craven draws live, at weddings, launches, and brand activations, and runs a fashion and illustration studio in Florida. For a service-area business like hers, the local search result is the storefront: she gets booked when someone planning an event searches for a 'live illustrator' nearby and finds her first.
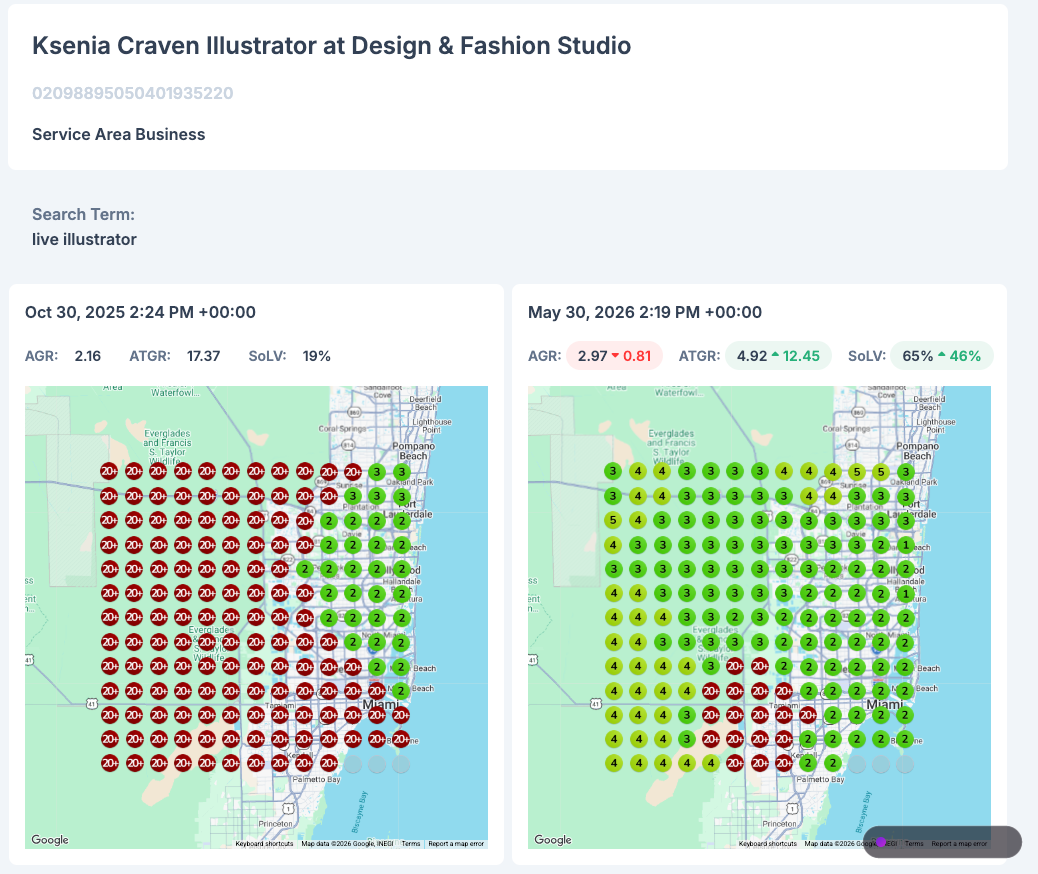
When we started, the map told a harsh story. On a geo-grid for 'live illustrator', her profile landed in the top three across just 19% of the area, a grid of mostly red. Step a little outside one small pocket and prospective clients searching close by simply never saw her.
What we did
- 01
Turn the Google Business Profile into a real local asset
A service-area business lives and dies on its Google Business Profile. We built hers out properly, categories, services, service areas, photos, and regular posts, so Google understood exactly what she does and where she does it.
- 02
Target the searches that actually book events
We focused on the local, high-intent terms that lead to bookings, 'live illustrator' and the way people phrase it when they need one nearby, instead of vanity keywords no client ever types.
- 03
Build local relevance and consistency
We tightened the on-page local signals, kept her name, address, and details consistent across the web, and leaned on genuine reviews, the trust signals Google weighs most for local results.
- 04
Measure on the map, not just rankings
We tracked progress on a geo-grid with Local Falcon, so we could see real coverage across the area she serves, not a single flattering rank from one location.
The results
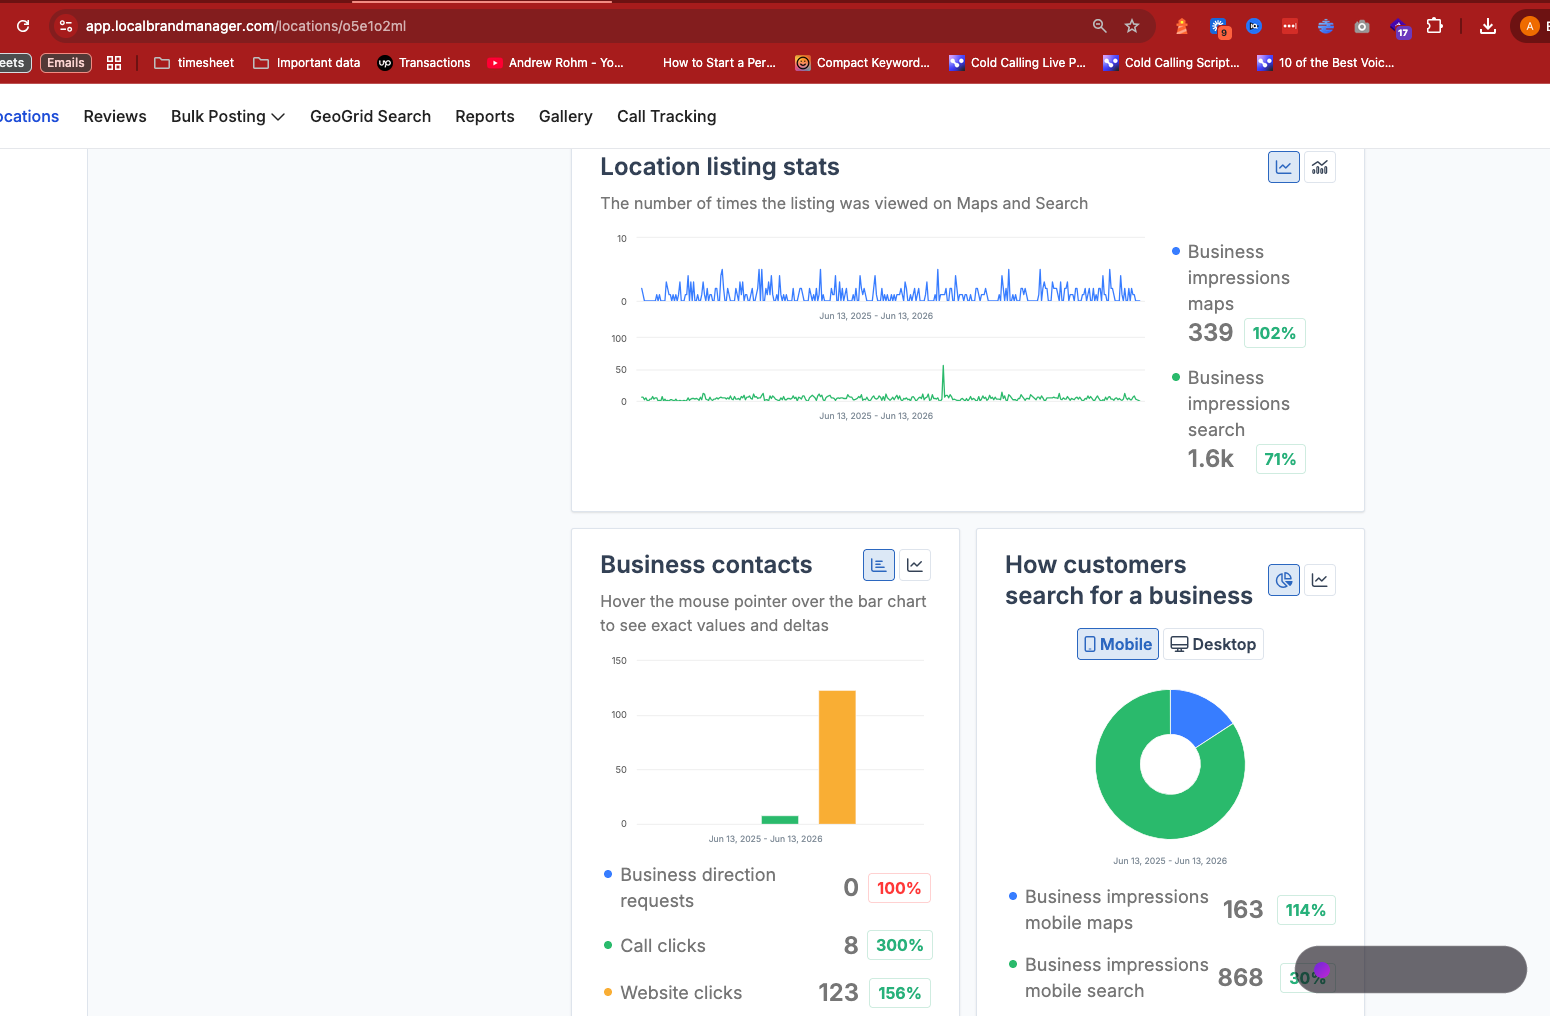
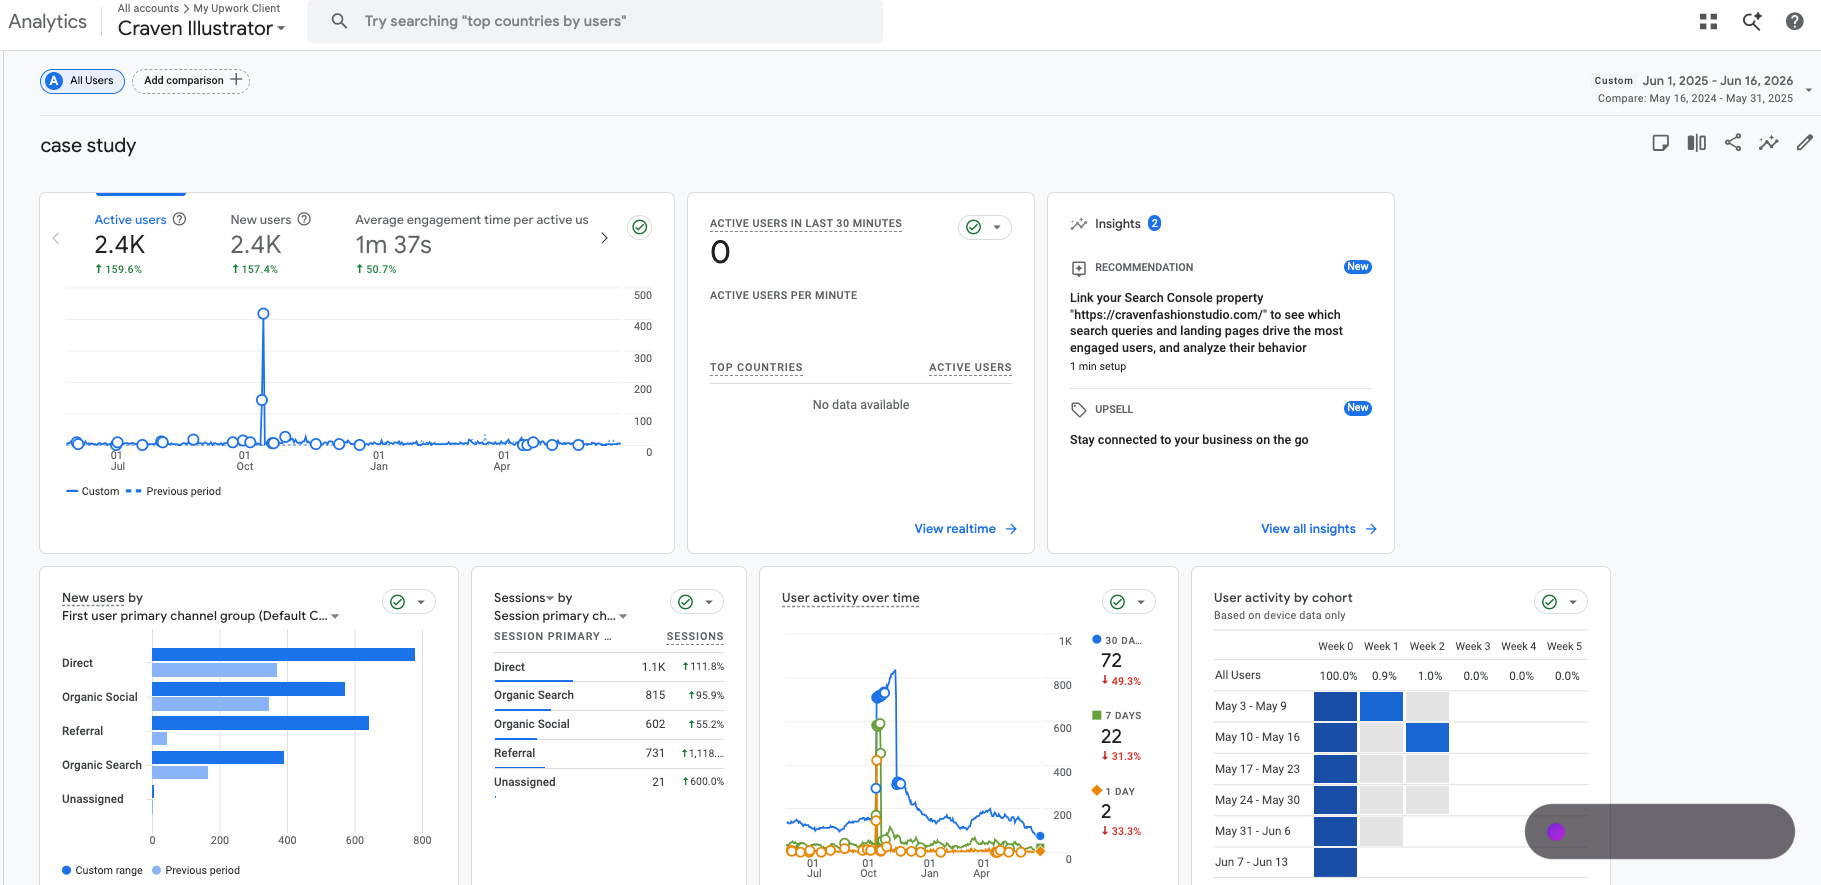
Over the engagement, the red grid turned green. Every figure below is pulled straight from the client's own Local Falcon, Google Business Profile, and GA4, and each is labelled with its source and date range, nothing invented, nothing without a receipt.
The headline is coverage. Share of Local Voice for 'live illustrator' climbed from 19% to 65%, so Ksenia now lands in the top three across nearly two-thirds of the area instead of a fifth. Average rank where she already showed held around the top three. The real change was how much of the map she now owns.
In their words
Craven Fashion Studio sent this over after working with us, unscripted, on camera. The same straight talk as the numbers above, in their own voice.
The evidence
Pulled straight from the client's own dashboards. Every figure is labelled with its source and date.
Want results like these for your business?